Contenu

Automobile Industrie
The Practical Guide to Surface Science (2026)

?s=100&d=m
Écrit par
No biography added yet.
Lire la suite
?s=100&d=m
Reviewed by
N/A
No biography added yet.
Lire la suite
?s=100&d=m
Written By

No biography added yet.

?s=100&d=m
Évalué par

N/A N/A

No biography added yet.

This is a practical guide to Surface Science for researchers working in the Automotive Industry.

Dans ce tout nouveau guide, vous apprendrez tout sur :

  • Crucial surface science principles
  • The significance of surface science measurements for the Automotive industry
  • Normes et directives ASTM applicables

Plongeons dans le vif du sujet.

Future of Automotive Manufacturing

Executive Summary

What it covers: A practical surface-science guide for the automotive industry explaining how to measure and use contact angle, surface tension (including dynamic), surface energy, and sliding/roll-off angle to evaluate coatings, treatments, and surface quality. It connects fundamentals to manufacturing use-cases (paint performance, rain-repellent windshields) and closes with a standards-and-reporting workflow.
Key insights: Real automotive surfaces rarely have a single “true” contact angle—roughness, contamination, and heterogeneity create hysteresis—so advancing/receding angles, hysteresis (Δθ), and sliding angle give a more reliable picture than one static value. Method choice matters: Young–Laplace is typically more consistent but assumes an axisymmetric drop, while polynomial fitting can handle non-axisymmetry at the cost of greater sensitivity to local imperfections; dynamic surface tension is essential when interfaces change quickly (droplet/bubble formation, foams, paint drying).
Business value: Improves decision-making on paints, sealants, and protective coatings by quantifying wettability, adhesion risk, and droplet mobility—reducing defects, rework, and performance drift. Enables faster root-cause triage and stronger process/supplier control by correlating surface texture + wetting metrics to functional outcomes (e.g., adhesion pass/fail, clearing performance, defect rates).
Standards to follow: Use an ISO 25178-2:2021 areal (3D) surface texture + wettability correlation workflow to distinguish “chemistry/contamination-driven” issues from “texture/roughness-driven” issues using measurable evidence. Standardize reporting with the guide’s minimum checklist (part/process state + zone mapping, ISO 25178 metrology settings and parameters, test liquid, droplet volume, static CA at a fixed timepoint, advancing/receding angles + hysteresis, sliding/roll-off angle with ramp rate, and environmental/reference controls).
Bottom line: This is a standards-aligned, shop-floor-relevant playbook that tells automotive teams what to measure, when to use dynamic vs static metrics, and how to interpret results safely (with guardrails) so surface data drives better coating performance and durability. Used well, it turns wettability and texture measurements into repeatable QC signals and process limits that map to real-world performance—not just lab numbers.

Chapitre 1 : Introduction

We analyze and improve the performance of automotive products by leveraging surface properties like surface tension and contact angles. These properties are crucial for understanding how coatings and treatments interact with vehicle surfaces, ultimately affecting the spread and adhesion of liquids on solids. Paints, sealants, and protective coatings rely heavily on these surface properties for their effectiveness and durability in the automotive industry. Automotive surface science merges precision engineering with material science to create products that not only protect and enhance vehicle surfaces but also maintain them. Striking the perfect balance between performance and appearance is paramount, ensuring that coatings can withstand environmental stressors, resist wear, and preserve the vehicle’s aesthetic appeal for years to come.

We use the following surface properties to understand the behavior of Automotive products and improve their quality.

Chapitre 2 : Mesure de l’angle de contact

L’angle de contact quantifie la mouillabilité d’une surface en représentant l’angle entre la surface d’un liquide et une surface solide.
Recherche Dropletlab

Sample Image taken from Droplet Lab Tensiometer.

Young – Méthode Laplace

Méthode polynomiale

Angle de contact dynamique

Ideally, when we place a drop on a solid surface, a unique angle exists between the liquid and the solid surface. We can calculate the value of this ideal contact angle (the so-called Young’s contact angle) using Young’s equation. In practice, due to surface geometry, roughness, heterogeneity, contamination, and deformation, the contact angle value on a surface is not necessarily a single consistent value but rather falls within a range. The upper and lower limits of this range are known as the advancing and receding contact angles, respectively. The values of advancing and receding contact angles for a solid surface are highly sensitive to many parameters, such as temperature, humidity, homogeneity, and minor contamination of the surface and liquid. For example, the advancing and receding contact angles of a surface can differ at different locations.

Angle de contact dynamique par rapport à l’angle de contact statique

Les surfaces et les revêtements pratiques présentent naturellement une hystérésis d’angle de contact, indiquant une gamme de valeurs d’équilibre. Lorsque nous mesurons les angles de contact statiques, nous obtenons une seule valeur dans cette plage. S’appuyer uniquement sur des mesures statiques pose des problèmes, tels qu’une mauvaise répétabilité et une évaluation incomplète de la surface en ce qui concerne l’adhérence, la propreté, la rugosité et l’homogénéité.

In practical applications, we need to understand how easily a liquid spreads (advancing angle) and how easily it is removed (receding angle), such as in painting and cleaning. Measuring advancing and receding angles offers a holistic view of liquid-solid interaction, unlike static measurements, which yield an arbitrary value within the range.

Ces informations sont cruciales pour les surfaces du monde réel avec des variations, une rugosité et une dynamique, aidant des industries telles que les cosmétiques, la science des matériaux et la biotechnologie à concevoir des surfaces efficaces et à optimiser les processus.

Découvrez comment la mesure de l’angle de contact est effectuée sur notre tensiomètre

Pour une compréhension plus complète de la mesure de l’angle de contact, lisez notre mesure de l’angle de contact : le guide définitif

Open Benchmark Data: Contact Angle & Surface Energy

These reference measurements show how deionized water wets four standard substrates measured with the Droplet Lab Dropometer. Use them as visual and numerical benchmarks when you're checking your own sample preparation, treatments, and chemistry.

Full contact angle and surface energy datasets (including additional liquids and statistics) are available on our dataset hub.

Glass - DI Water
Glass - DI Water
Nylon - DI Water
Nylon - DI Water
PMMA - DI Water
PMMA - DI Water
Teflon - DI Water
Teflon - DI Water

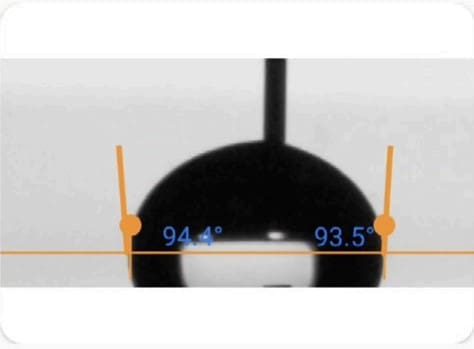
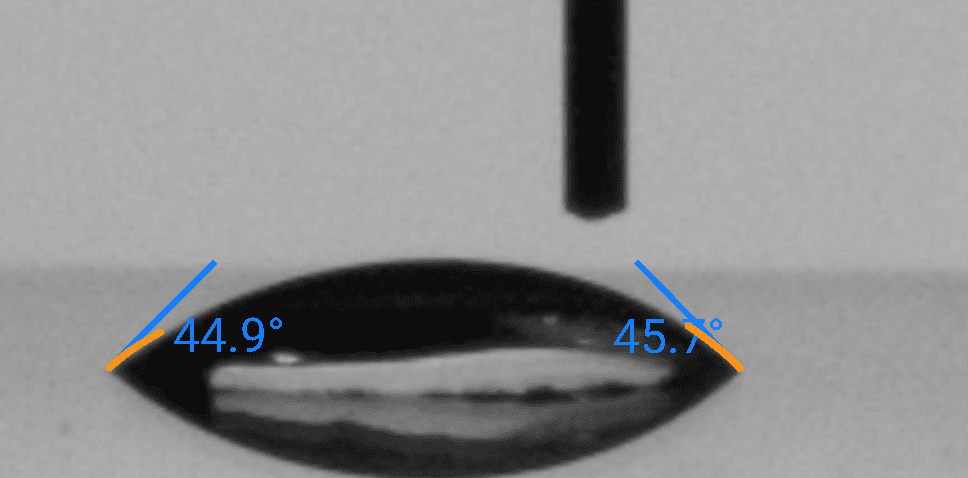
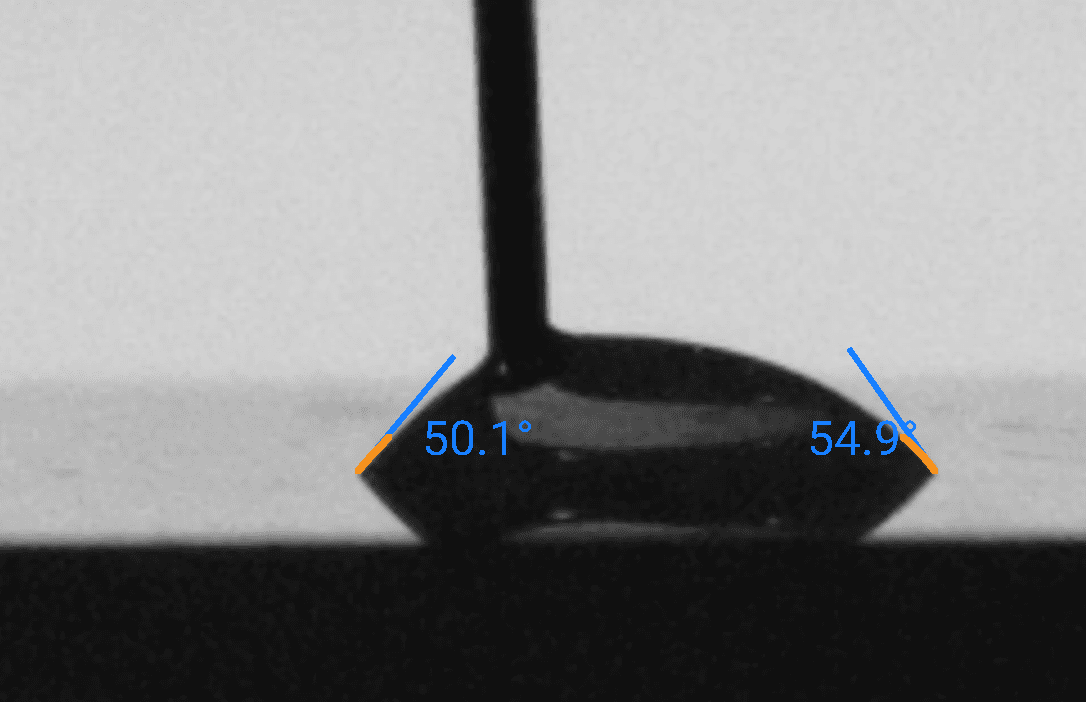
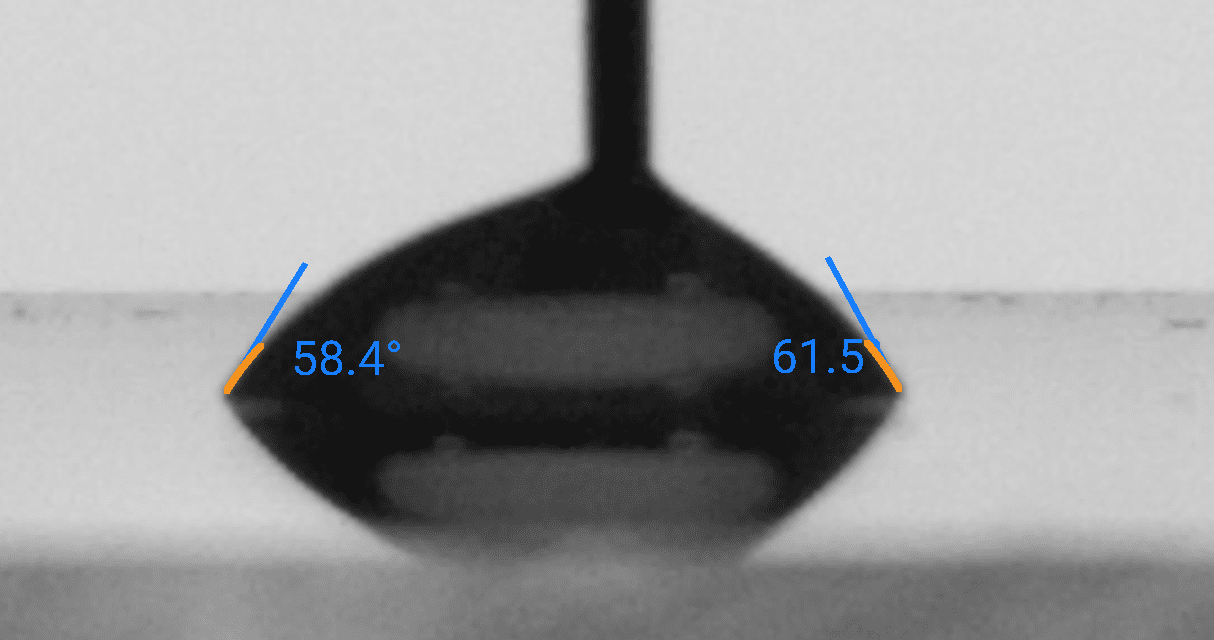
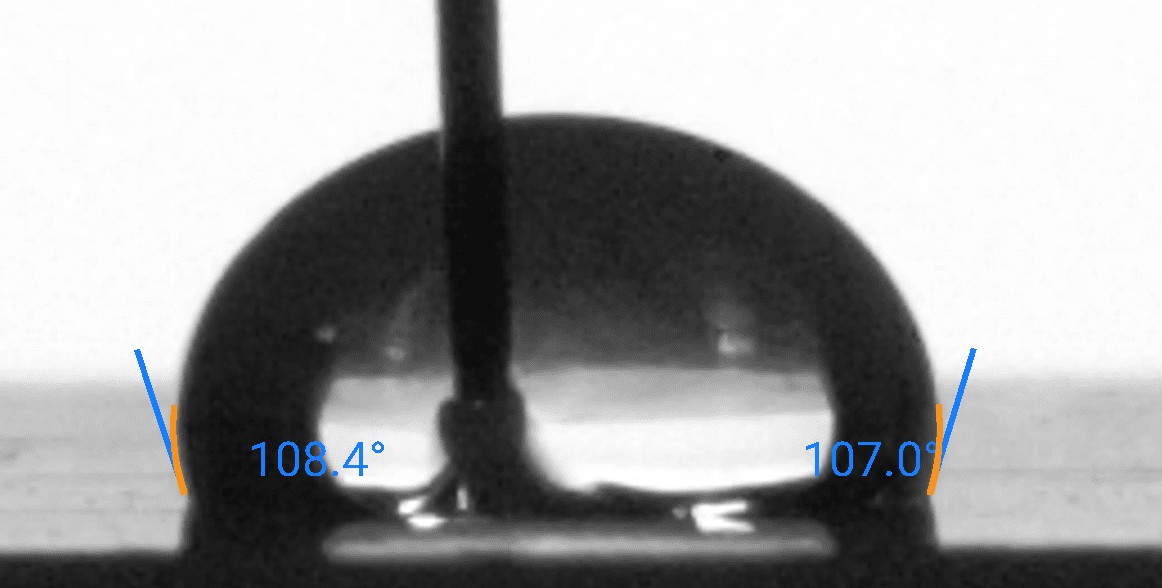
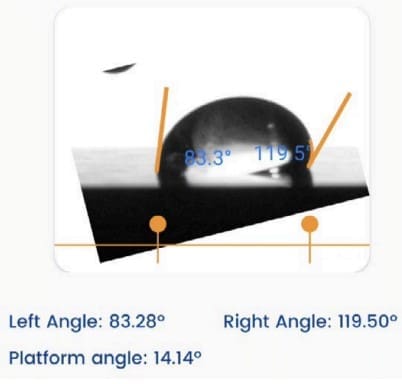
The droplet images above are taken from the same benchmark series as our open dataset. For each substrate and probe liquid we report:

● Advancing and receding contact angles (and hysteresis)
● Derived surface energy (SFE) values based on multi-liquid measurements
● Measurement conditions, uncertainties, and sample preparation details

Comparing your own droplet shapes and angles against these references is a fast way to spot contamination, treatment drift, or unexpected changes in wettability.

Chapitre 3 : Mesure de la tension superficielle

Cette propriété mesure la force qui agit à la surface d’un liquide, dans le but de minimiser sa surface.

Mesure de la tension superficielle

Sample Image taken from Droplet Lab Tensiometer

Tension superficielle dynamique

La tension superficielle dynamique diffère de la tension superficielle statique, qui fait référence à l’énergie de surface par unité de surface (ou à la force agissant par unité de longueur le long du bord d’une surface liquide).

La tension superficielle statique caractérise l’état d’équilibre de l’interface liquide, tandis que la tension superficielle dynamique tient compte de la cinétique des changements à l’interface. Ces changements peuvent impliquer la présence de tensioactifs, d’additifs ou de variations de température, de pression et de composition à l’interface.

Quand utiliser la mesure dynamique de la tension superficielle

Dynamic surface tension is essential for processes that involve rapid changes at the liquid-gas or liquid-liquid interface, such as droplet and bubble formation, coalescence (change in surface area), the behavior of foams, and the drying of paints (change in composition, e.g., evaporation of solvent). It is measured by analyzing the shape of a hanging droplet over time.

La tension superficielle dynamique s’applique à diverses industries, notamment les cosmétiques, les revêtements, les produits pharmaceutiques, la peinture, l’alimentation et les boissons, ainsi que les processus industriels, où la compréhension et le contrôle du comportement des interfaces liquides sont essentiels pour la qualité du produit et l’efficacité des processus.

Apprenez comment la mesure de la tension superficielle est effectuée sur notre tensiomètre

Pour une compréhension plus complète de la mesure de l’énergie de surface, lisez notre mesure de la tension superficielle : le guide définitif

Chapitre 4 : Mesure de l’énergie de surface

L’énergie de surface fait référence à l’énergie nécessaire pour créer une unité de surface d’une nouvelle surface.
231

Sample Image taken from Droplet Lab Tensiometer

Découvrez comment la mesure de l’énergie de surface est effectuée sur notre tensiomètre

Pour une compréhension plus complète de la mesure de l’énergie de surface, lisez notre mesure de l’énergie de surface : le guide définitif

For benchmark contact angle and surface energy values on glass, nylon, PMMA, and Teflon, see the Open Benchmark Data panel above or visit our Dataset Hub for full CSV downloads.

Chapitre 5 : Mesure de l’angle de glissement

L’angle de glissement mesure l’angle auquel un film liquide glisse sur une surface solide. Il est couramment utilisé pour évaluer la résistance au glissement d’une surface.

Angle de glissement 1

Sample Image taken from Droplet Lab Tensiometer

Apprenez comment la mesure de l’angle de glissement est effectuée sur notre tensiomètre

Pour une compréhension plus complète de la mesure de l’angle de glissement, lisez notre Mesure de l’angle de glissement : le guide définitif

Chapitre 6 : Applications dans le monde réel

Within the Automotive industry, several case studies exemplify the advantages of conducting surface property measurements.

Optimizing Automotive Paint

We applied four different paints (A, B, C, and D) to curved metal surfaces like car hoods and doors to identify the most water-repellent option. We used contact angle as the key measure, with a larger angle indicating better water repellency. Paint A completely absorbed water droplets, while Paint B formed a 36-degree contact angle. Paints C and D achieved even better results, with contact angles of 42 and 58 degrees, respectively. These measurements represent the average of 8 and 10 readings for paints A and B, and C and D, respectively. Based on these results, Paint D emerges as the most suitable candidate for water resistance, clearly demonstrated by its superior contact angle. Conversely, Paint A proves entirely unsuitable, allowing water to spread and potentially be absorbed due to its minimal contact angle.

Optimizing Automotive Paint

pare-brise automobile et résistance à la pluie

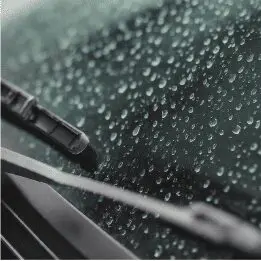
L’industrie automobile privilégie le maintien d’une visibilité claire pour les conducteurs sous la pluie afin d’assurer la sécurité. Les pare-brise traditionnels ont souvent du mal à s’accumuler de l’eau, ce qui compromet la visibilité et met les conducteurs en danger. Pour y remédier, l’industrie a développé une solution unique : l’application d’un revêtement hydrophobe à faible angle de glissement sur les pare-brise automobiles. Ce faible angle permet à l’eau de pluie de glisser facilement de la surface, ce qui réduit considérablement l’accumulation d’eau et améliore considérablement la visibilité et la sécurité du conducteur dans des conditions pluvieuses.

pare-brise automobile et résistance à la pluie

Nous sommes vos partenaires dans la résolution de votre activité et de votre Défis

Si vous êtes intéressé par la mise en œuvre de ces applications ou de toute autre application, veuillez nous contacter.

Chapitre 7 : Normes et lignes directrices

In an industry where precision reigns supreme, how can Automotive manufacturers ensure their products withstand scrutiny? The answer lies in standards and guidelines: the compass that guides them through the complex maze of quality and performance.

ISO 25178-2:2021 + Wettability Correlation — Automotive Surface Texture (Dropometer companion workflow)

What it is

A combined characterization workflow that pairs ISO 25178 areal (3D) surface texture parameters with quantitative wettability and droplet-mobility metrics to explain whether functional performance is driven mainly by surface chemistry/contamination or by texture/roughness state. Dropometer provides the wettability/mobility measurements; ISO 25178 texture metrology must be performed separately using a profilometer/interferometer.

When to use it

Root-cause triage for functional failures (adhesion, water retention, coating defects, sensor clearing):

Use when a part fails or drifts and you need to separate “chemistry/contamination” causes from “texture recipe/process” causes with measurable evidence.

Qualification and supplier/process control (new coating/primer, micro-pattern, etch/blast/tool-wear changes):

Use when establishing PPAP/APQP-ready limits by correlating texture parameters + wetting/mobility outputs to real performance outcomes.

In-scope / Out-of-scope

In scope
  • ISO 25178 areal texture parameter reporting under fixed metrology settings (typical starter set: Sa, Sq, Sdq, Sdr, Str, Std).
  • Wettability + droplet mobility testing (static contact angle at a fixed timepoint, advancing/receding angles where stable, hysteresis, sliding/roll-off angle).
  • Zone-based mapping on real parts (center/edge/functional zones) with variability reporting (median + IQR).
  • Part-family correlation model linking texture + wettability outputs to an agreed functional outcome (e.g., adhesion pass/fail, clearing requirement, defect rate).
Out of scope
  • Performing ISO 25178 texture metrology with Dropometer (Dropometer does not measure 3D areal texture).
  • Claiming ISO 25178 compliance/certification or reproducing normative ISO standard text (this is a companion workflow, not a certification).
  • Universal “roughness corrections” using Wenzel/Cassie as a guarantee (model assumptions and metastability/pinning can invalidate simple corrections).
  • Liquid surface tension/surface energy determination as a substitute for functional validation unless you also apply appropriate methods and prove correlation for your process.

Minimum you must report (checklist)

  • Part/substrate identification + process state (material, coating/primer, treatment history, cleanliness/handling state) and zone map used.
  • ISO 25178 metrology settings (instrument type, measurement area, objective, sampling/resolution, filtering) and the reported parameter set (at minimum Sa/Sq + Sdr/Sdq; add Str/Std if directionality matters).
  • Test liquid (DI water or process-relevant liquid) and any critical notes (e.g., surfactants/solvents if used).
  • Droplet volume (choose one per part family, e.g., 5 µL or 10 µL) and dispense method.
  • Static contact angle at a fixed timepoint (e.g., CA @ 2.0 s ± 0.2 s), with replicate count and median + IQR per zone.
  • Advancing (θₐ) and receding (θᵣ) angles where stable, plus hysteresis Δθ = θₐ − θᵣ, including the dosing/withdrawal approach and stability rejection rules.
  • Sliding/roll-off angle (α) including tilt ramp rate, droplet volume, and pass/fail criteria for valid roll-off events.
  • Data quality + controls: environment (temperature/RH), reference/golden sample result for the run, and rejection criteria used (e.g., failed edge detection/fit QC, vibration, gross non-axisymmetry not attributable to the surface).

Note: Correlation thresholds must be calibrated per part family + process by tying texture + wettability outputs to actual functional outcomes (adhesion test, clearing/fogging performance, defect/return rates). Treat Wenzel/Cassie interpretations as diagnostic models with assumptions, not as universal truth.

How to interpret results (guardrails)

  • Chemistry/contamination-dominated drift: Wettability/mobility shifts (CA@time, Δθ, α) without meaningful change in ISO 25178 parameters; re-check handling/cleaning and confirm with a reference panel.
  • Texture-dominated drift: ISO 25178 parameters shift (often Sdr/Sdq/Str/Std), and wettability/mobility moves consistently with them; verify metrology settings are locked, then investigate texture process steps (etch/blast/patterning/tool wear).
  • Regime change (Wenzel-like ↔ Cassie-like behavior): Static CA may remain similar while Δθ and α change dramatically; treat this as a potential wetting-state shift and validate droplet size vs feature scale plus pinning/metastability controls.
  • Don’t certify “self-cleaning” from static CA alone: Use mobility (α) and hysteresis (Δθ) as primary functional indicators for clearing, and set acceptance limits from your calibrated performance data (not generic thresholds).

Maintenant, c’est à votre tour

We hope this guide showed you how to apply surface science in the Automotive industry.

Maintenant, nous aimerions vous céder la parole :

Feel free to leave a comment below—we’d love to hear from you.

Laisser une réponse

Votre adresse e-mail ne sera pas publiée. Les champs obligatoires sont marqués *


Télécharger l’expérience