|
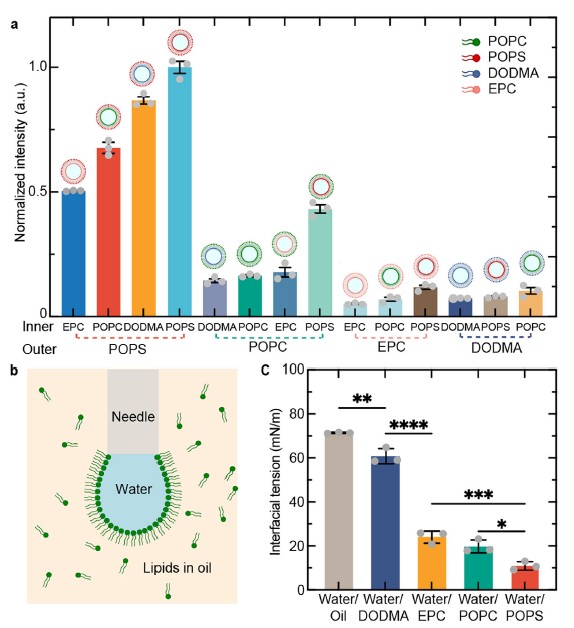
Interfacial tension — DODMA
|
DODMA in mineral oil
|
61.5 ± 3.5 mN/m
|
Pendant drop · Droplet Lab
|
0.06 mM; n = 3
|
Highest among lipid-containing systems; lowest vesicle yield. Only value with SD stated in paper text.
|
|
Interfacial tension — EPC
|
EPC in mineral oil
|
Approx. 25 mN/m (Figure 3c)
|
Pendant drop · Droplet Lab
|
0.06 mM; n = 3
|
SD readable from Figure 3c error bars; not stated in text
|
|
Interfacial tension — POPC
|
POPC in mineral oil
|
Approx. 20 mN/m (Figure 3c)
|
Pendant drop · Droplet Lab
|
0.06 mM; n = 3
|
SD readable from Figure 3c error bars; not stated in text
|
|
Interfacial tension — POPS
|
POPS in mineral oil
|
Approx. 12 mN/m (Figure 3c)
|
Pendant drop · Droplet Lab
|
0.06 mM; n = 3
|
Lowest interfacial tension; correlated with highest vesicle yield. SD readable from Figure 3c.
|
|
Interfacial tension — no-lipid baseline
|
Mineral oil / PBS only
|
Approx. 50 mN/m (Figure 3c)
|
Pendant drop · Droplet Lab
|
No lipid; n = 3
|
Reference condition; highest value in the series
|
|
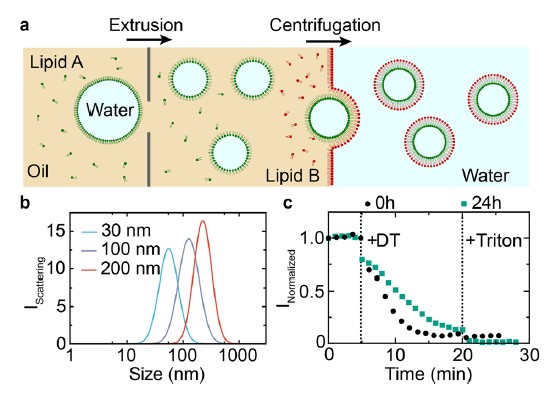
Vesicle asymmetry
|
NBD-PE outer leaflet; dithionite quenching
|
>90% asymmetry; stable to 22 days; ~35% flip-flop by day 30
|
Fluorescence quenching assay
|
Triton X disruption control; n = 3
|
Figure 1c, 2d
|
|
Zeta potential — outer leaflet control
|
POPC inner / EPC or POPS outer (0–100%)
|
+50 mV (EPC) to −41 mV (POPS); inner leaflet changes produce no change
|
Zetasizer Pro · Malvern
|
n = 3; 20 readings per measurement
|
Zeta potential set exclusively by outer leaflet (Figure 2a–b)
|
|
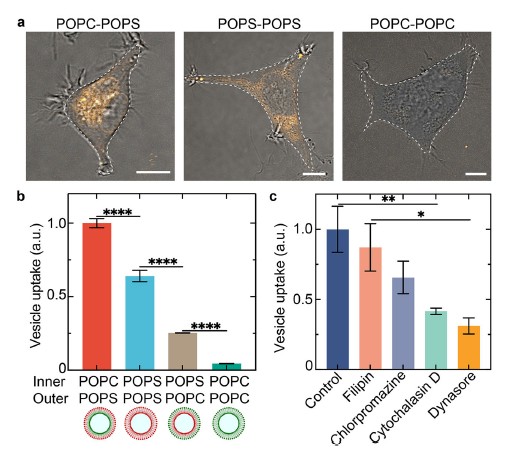
Cellular uptake
|
POPC-POPC, POPS-POPS, POPC-POPS, POPS-POPC
|
POPC-POPS ~2× higher than POPS-POPS; POPS-POPC ~4× lower than POPC-POPS
|
Confocal + flow cytometry
|
HEK293; 6 h; n > 15,300 cells
|
Directionality of asymmetry matters, not just composition. Clathrin-mediated endocytosis confirmed (Figure 4)
|
|
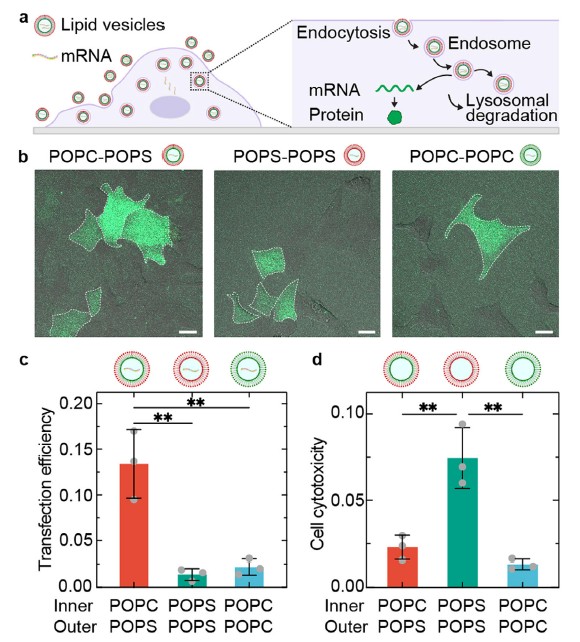
mRNA transfection
|
GFP mRNA; POPC-POPS vs POPS-POPS vs POPC-POPC
|
POPC-POPS: 9× higher vs POPC-POPC; 7× higher vs POPS-POPS
|
Confocal microscopy
|
HEK293; 48 h; n = 3
|
Optimised commercial LNPs ~50% efficiency vs asymmetric vesicles in this study (Figure S17, Figure 5c)
|
|
Cytotoxicity
|
POPC-POPS vs POPS-POPS
|
POPC-POPS significantly lower LDH release despite higher uptake
|
CyQUANT LDH assay · plate reader
|
HEK293; 24 h; n = 3 triplicates
|
Mechanism not elucidated (Figure 5d)
|
|
Protein delivery
|
Streptavidin (60 kDa), IgG (150 kDa), Cas9-GFP (160 kDa), B-Phycoerythrin (240 kDa)
|
Cytoplasmic protein presence confirmed; ~40% Cas9 nuclear localisation
|
Confocal microscopy
|
HEK293; EPC-POPS vesicles; n = 15 for nuclear quantification
|
Cas9 carries NLS tag enabling nuclear targeting; IgG at similar MW does not localise to nucleus (Figure 6)
|
|
Gene editing
|
EnGen Spy Cas9 NLS + sgRNA (TTR target); EPC-POPS vesicles
|
7% editing efficiency (HEK293); 9% (HeLa)
|
Next-gen sequencing · Illumina NextSeq 1000; CRISPResso2
|
48 h; lipofectamine benchmark 82%
|
NLS-tagged Cas9 (NEB EnGen Spy Cas9 NLS) used specifically to enable nuclear localisation. Proof-of-concept; large gap vs benchmark remains (Figure S21)
|
|
Vesicle size — pore size study
|
POPC/POPS; 30, 100, 200 nm membranes
|
65 nm / 150 nm / 250 nm (hydrodynamic diameter)
|
DLS · Malvern ZetaSizer Nano ZS; TEM (Figure S1)
|
Polycarbonate membrane extrusion
|
Size tuned by membrane pore diameter (Figure 1b); TEM confirms DLS
|